Reconsidering access paths for index ordering… a dangerous optimization… and a fix!

MySQL has had an interesting optimization for years now1, which has popped up from time to time: in certain circumstances, it may choose to use an index that is index-wise less efficient, but provides the resulting rows in order, to avoid a filesort of the result.

What does this typically look like in production? A query that seems simple and easy takes much longer than it should, sometimes. (Perhaps in production, the query gets killed by pt-kill or exceeds the max_execution_time provided.) The query could be very simple indeed:

SELECT ... WHERE `other_id` = 555 ORDER BY `id` ASC LIMIT 1

There’s an index on other_id, and running the query with an appropriate USE INDEX, the query is fast. Even weirder, changing the query to use LIMIT 10 causes it to run lightning-fast! If anything, the LIMIT 1 should be faster… so, what gives?

Looking at the EXPLAIN, you may notice that the LIMIT 1 version is using access type index on the PRIMARY key (in this case id), whereas the LIMIT 10 version is using ref on a secondary key. Access type index means a full-index scan… on the primary key… which is the clustered key… which is a full table scan.

The optimization is hoping that the LIMIT n with a small enough limit will allow execution to be completed early, without scanning many rows, once the LIMIT is satisfied. This hope is often misplaced: there is no guarantee that there will be any matching rows in the first m rows of the table when ordered by the unwisely-chosen index. Hope is not a strategy.

Although the underlying issue had been reported several times already, under various circumstances, since there were so many individual bugs reported, I filed a new bug with a summary of the situation… and a patch: MySQL Bug 97001.

On MySQL Bug 97001, I proposed a solution (and provided a patch, submitted to Oracle under the NDA) introducing a new optimizer_switch flag named reconsider_index_for_order (defaulting to on to duplicate the current behavior). Although this optimization might benefit some queries, it’s too dependent on the actual data in the involved tables, so it’s not a good candidate for a general optimizer feature in my opinion. Maybe the default could eventually be off allowing users to opt into this optimization when they want it but providing compatible default behavior.

1 The underlying optimization actually appears to be have roots in some very old code, most importantly probably one specific commit in 5.1.

Visualizing the impact of ordered vs. random index insertion in InnoDB

[This post refers to innodb_ruby version 0.9.11 as of October 2, 2014.]

Many DBAs know that building indexes in “random” order (or really any order that greatly differs from ordered by key) can be much less efficient. However, it’s often hard to really understand why that is. With the “-illustrate” visualization modes available in innodb_ruby, it’s possible to quite easily visualize the structure of indexes. The space-lsn-age-illustrate mode to innodb_space allows visualization of all pages in a space file by “LSN age”, generating something like a heatmap of the space file based on how recently each page was modified.

(Note that a small Ruby script generate_data_simple.rb was used to generate the test tables used below. You’ll also want to have a reasonable monospace font supporting Unicode block characters correctly, for which I’d heartily recommend Adobe’s Source Code Pro.)

Building an index by insertion in key order

Inserting rows into an index in key order is much more efficient primarily for two reasons:

  1. Pages can be filled completely, and the database (with sufficient optimizations present) can detect the “bulk loading” behavior and efficiently split pages by creating new, empty pages, rather than splitting pages in half.
  2. Only the “edge” of the index is being written to; once a page has filled it will not be revisited. This can make the buffer pool, which caches database pages, much more effective.

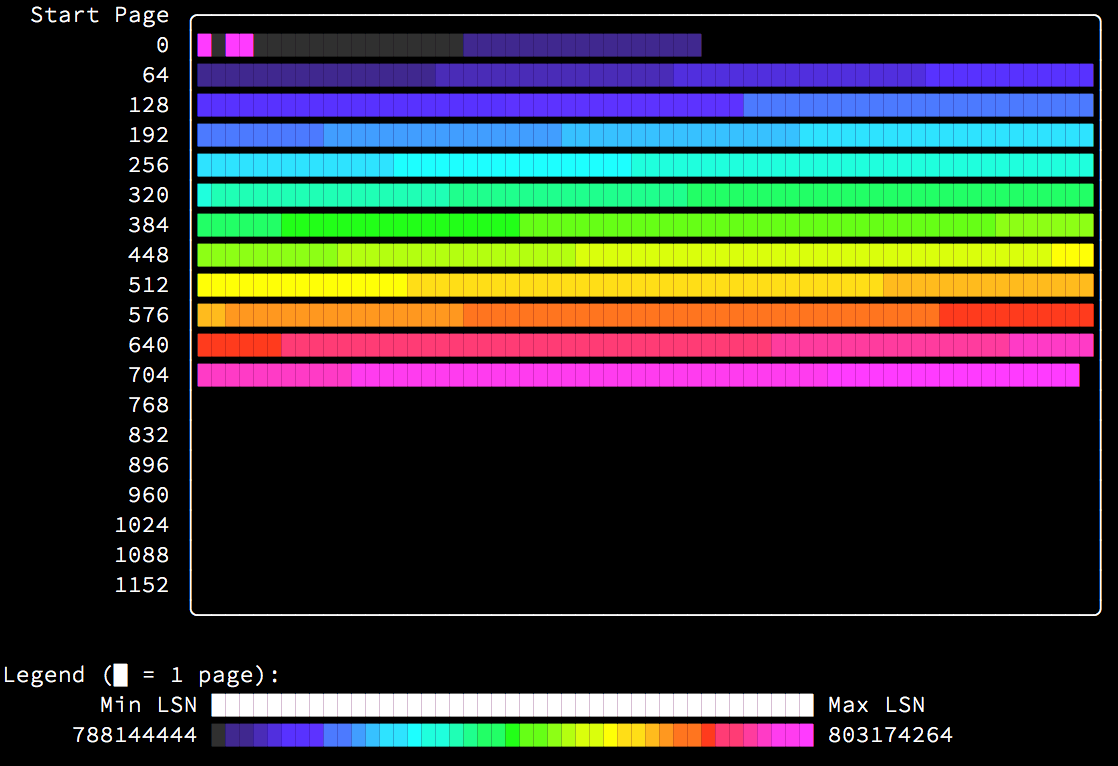
Here’s an example of a table with only a PRIMARY KEY clustered index, built by inserting rows in key order:

$ innodb_space -s ibdata1 -T test/t space-lsn-age-illustrate

As you can see in the above image, the index pages are written to in nearly perfect order as they are allocated from the beginning of the file towards the end.

The first extent (the first line of the image) is allocated as a fragment extent, and contains single pages allocated for different purposes. You can clearly see the tablespace bookkeeping pages, FSP_HDR at page 0 and INODE at page 2, immediately followed by the root index page at page 3, all very recently modified. Following that are 32 individually allocated “fragment” pages which were allocated first in the index before it switched to allocating full extents. Then the index pages progress perfectly until the end of the used space.

Also note the LSN age histogram (printed in white above the colored legend at the bottom) shows all buckets equally filled.

Building an index by insertion in random order

Looking at an index built by insertion in key order was reassuring. What if it is built in random order instead? The result is perhaps a bit surprising:

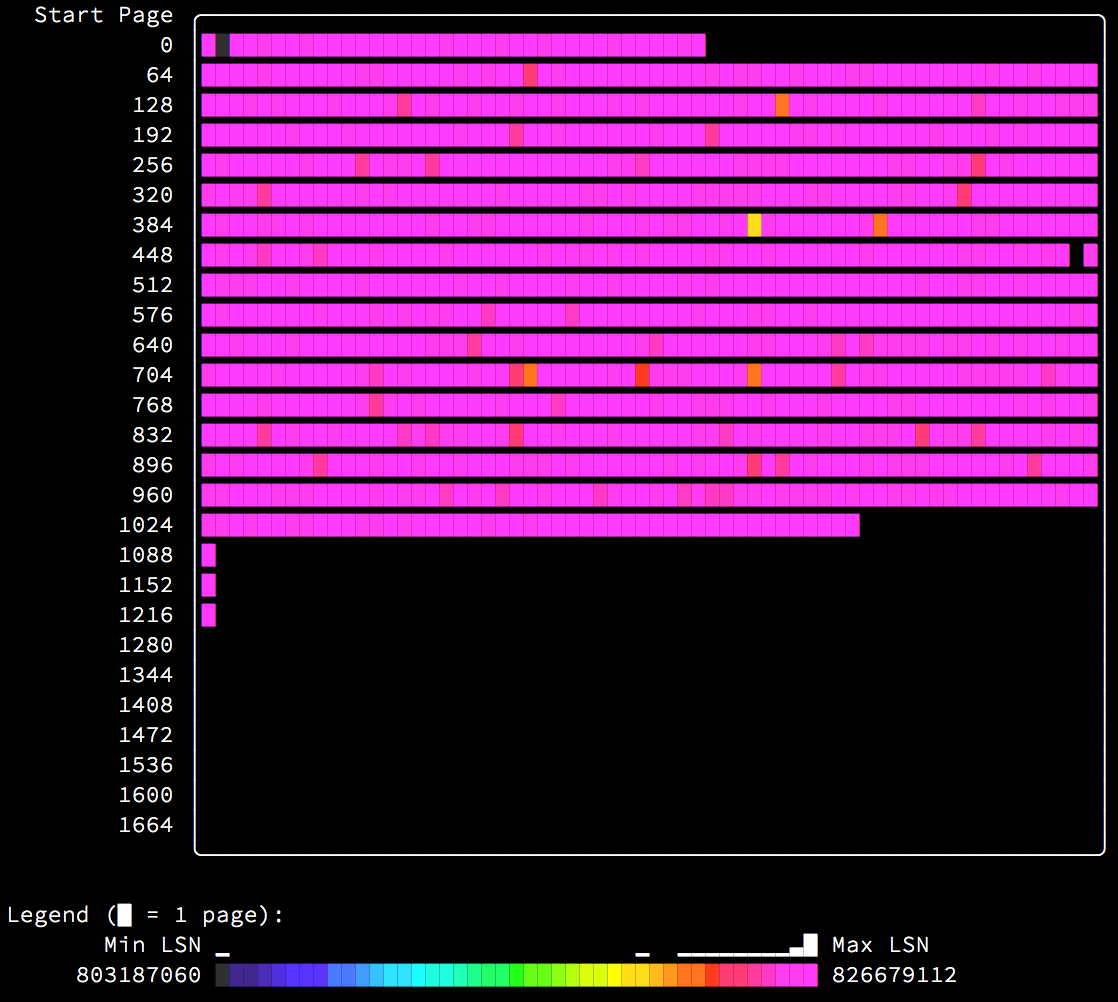
$ innodb_space -s ibdata1 -T test/t_shuffle space-lsn-age-illustrate

Because the rows were inserted in completely random order, every page has an equal chance for insertion. This means in practice that every page is very recently modified, and this is clearly visible by the entire heatmap being purple. What this also means is that the entire table must be continually present in the buffer pool, and if it doesn’t fit, performance will suffer greatly. This is the main reason that performance of insertion in random order is terrible.

Additionally, you can see a few misbehaviors of InnoDB: Note the extents starting at page 1088, 1152, and 1216. Why do you think they look like that? Let me know your ideas in the comments.

Building a primary and secondary index in primary key order

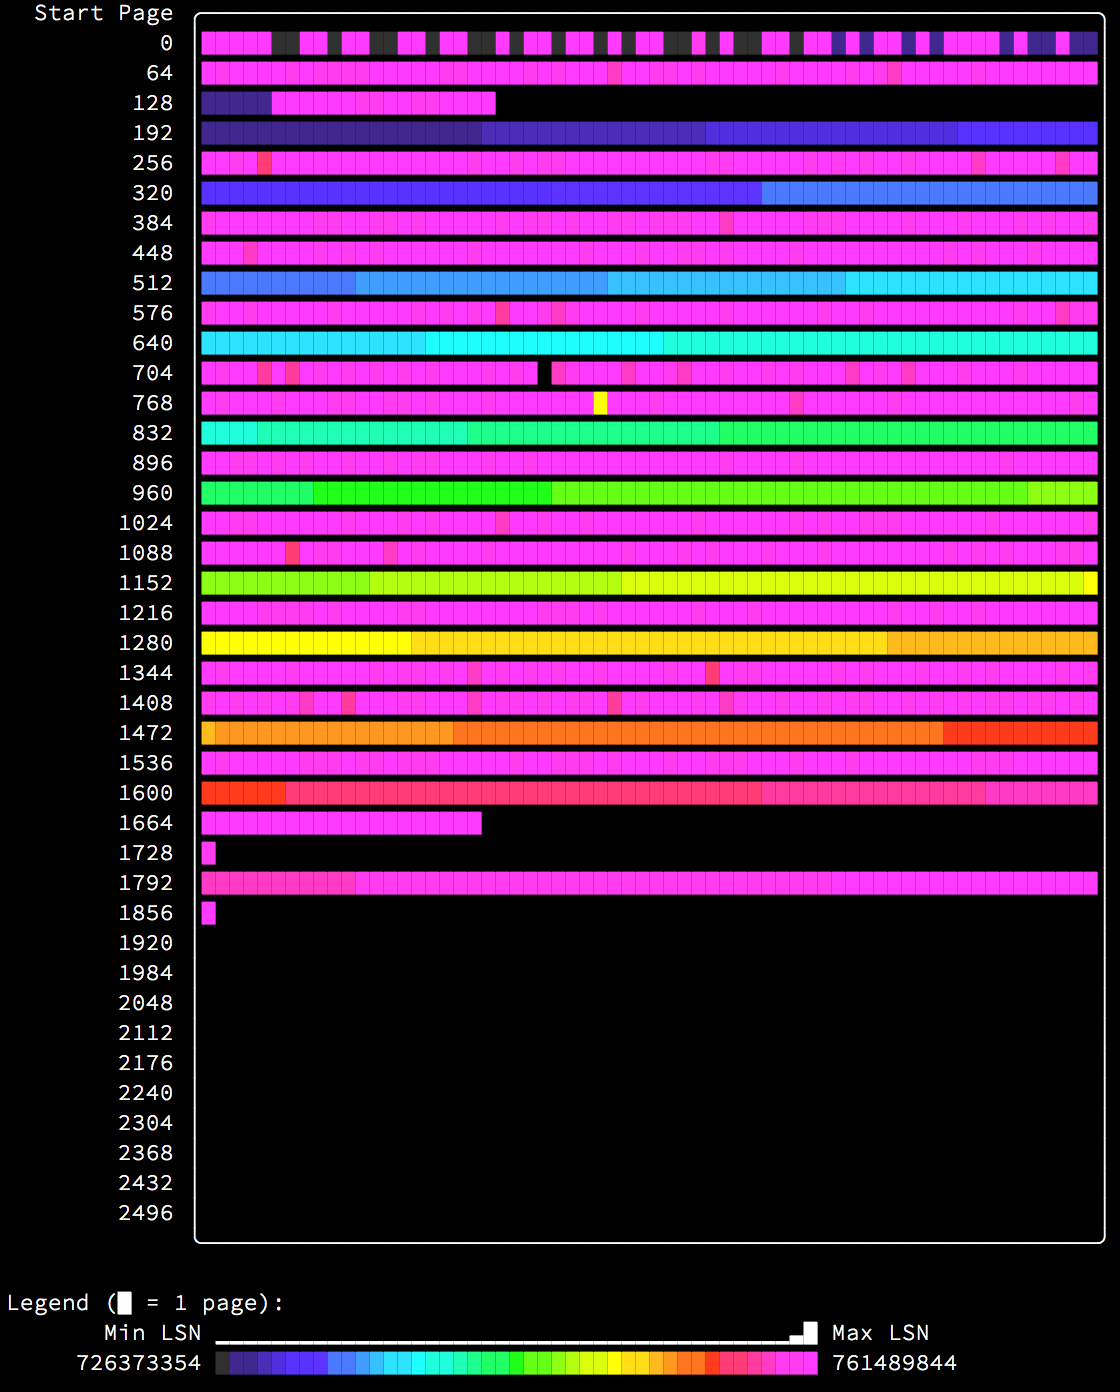
What if you have multiple indexes? Looking at a very simple and typical case, inserting data in key order by the primary key, while a secondary index exists:

$ innodb_space -s ibdata1 -T test/t_index_before space-lsn-age-illustrate

Notice that this looks like the previous cases perfectly interleaved together, because it is exactly that. Since the primary key and secondary index contain completely different data, insertion is ordered by the primary key, but completely mis-ordered by the secondary index, resulting in the secondary index being built inefficiently.

Adding a secondary index to an existing table

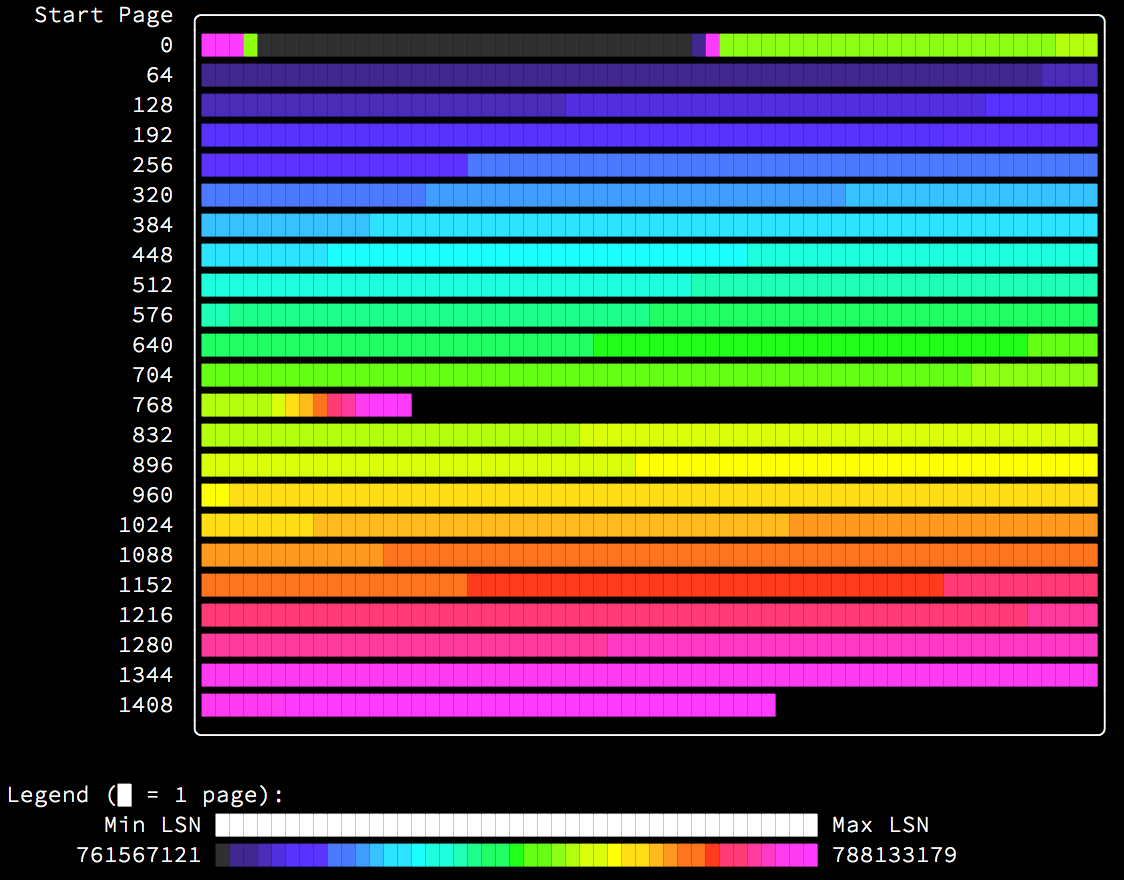
The obvious answer then to the previous problem is to add the index after the data has been loaded, and this does in fact result in the expected outcome:

$ innodb_space -s ibdata1 -T test/t_index_after space-lsn-age-illustrate

When the index is built on the existing table (via ALTER TABLE ... ADD INDEX), it is built by scanning and sorting the data before insertion into the index, resulting in an optimal (and very fast) index build.

Visualizing page fill rate

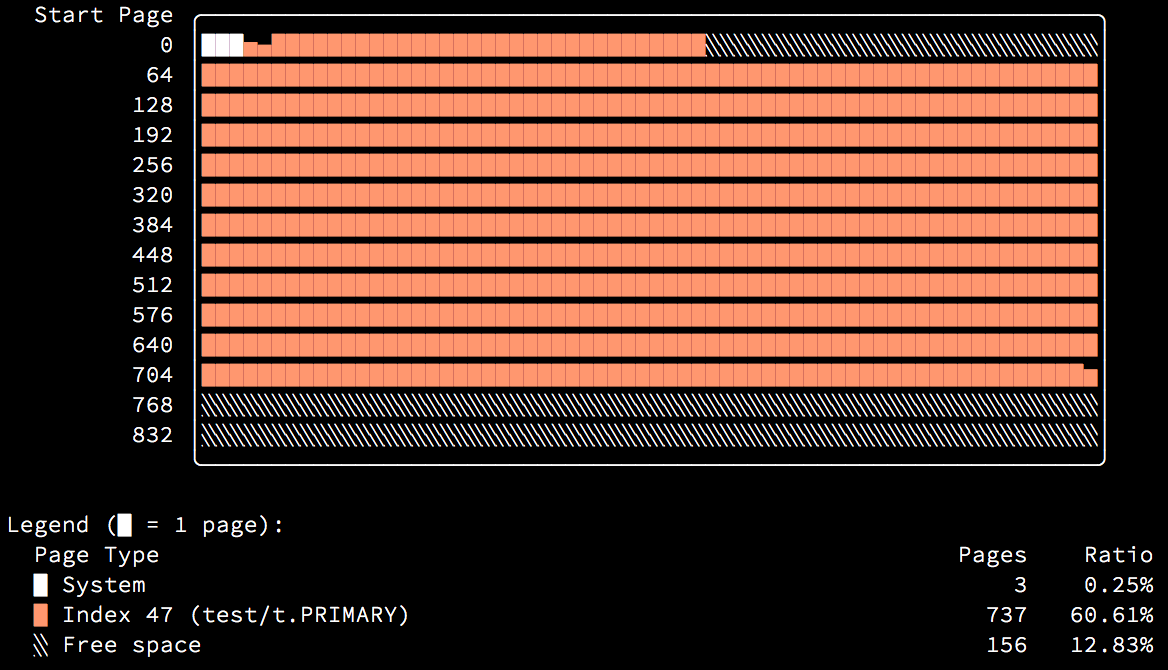
While the above illustrations show how recently each page was modified during the index build, it’s also possible to use space-extents-illustrate to visualize how full each page is. The key-ordered index looks like this:

$ innodb_space -s ibdata1 -T test/t space-extents-illustrate

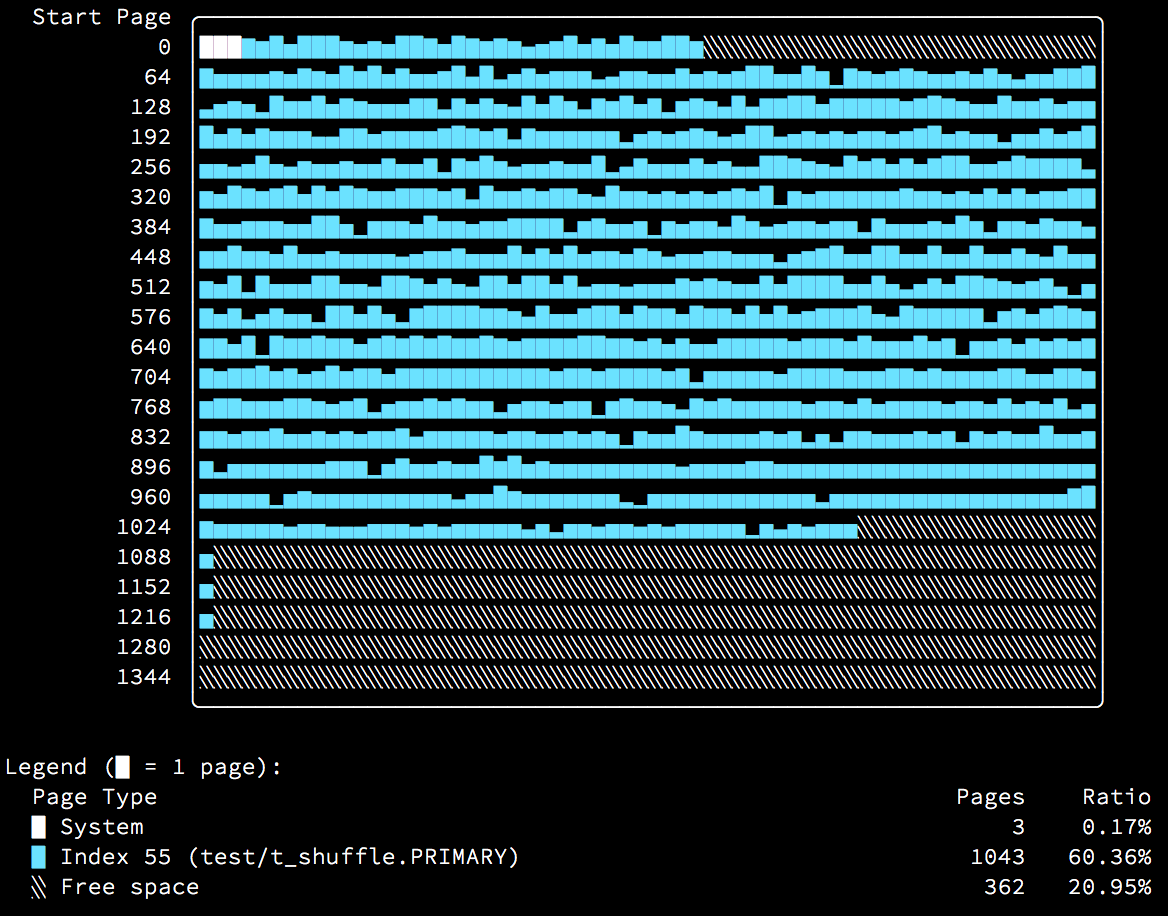
Compared to the random-ordered index:

$ innodb_space -s ibdata1 -T test/t_shuffle space-extents-illustrate

The random-ordered insertion caused pages to be split more frequently, and in some cases to be severely under-filled, causing a very poor page fill rate on average.

Those of you who are particularly observant will have noticed that the index illustrations in the first pictures above showed that the ordered-insertion index is significantly smaller than the random one. You can see here that the random-insertion index is 41% larger at 1043 pages compared to just 737 pages for the ordered-insertion index. Additionally, 206 more pages are left unused, making the actual disk space usage 57% larger.

Thanks, Oracle for fixing MySQL Bug 69477

Just under a year ago, on June 14, 2013, I reported MySQL Bug 69477 (and MariaDB Bug MDEV-4662) titled “InnoDB: Use of large externally-stored fields makes crash recovery lose data”. The gist of this bug is that if you use large BLOB fields (> ~10% of your InnoDB redo logs size), you can compromise crash recovery and suffer data loss after a crash.

The MySQL bug was marked as “Verified” in less than an hour (wow!), but since then there was not a single word about it. Suddenly a couple of days ago, I got an email with “[Com,Ver->Csd]” in the subject. My immediate thought was “Damn it, closed?! How can they close it?! It’s a bug!” — however, upon opening the email I noticed it was not closed as “Won’t fix”, but rather, it was fixed!

Daniel Price at Oracle left the following comment on the bug:

Fixed as of 5.6.20, 5.7.5, and here’s the changelog entry:

Redo log writes for large, externally stored “BLOB” fields could overwrite the most recent checkpoint. The 5.6.20 patch limits the size of redo log “BLOB” writes to 10% of the redo log file size. The 5.7.5 patch addresses the bug without imposing a limitation. For MySQL 5.5, the bug remains a known limitation.

The limitation has also been documented in the reference manual. The changes should appear soon, with the next published documentation build.

http://dev.mysql.com/doc/refman/5.1/en/innodb-restrictions.html
http://dev.mysql.com/doc/refman/5.5/en/innodb-restrictions.html

Thank you for the bug report.

Thanks, Oracle, for fixing1 this bug! I look forward to seeing the fix in both 5.6 and 5.7. I was just thinking the other day that I might have to fix it myself, because it seemed like nobody was working on it.

1 Maybe next time leave a comment that you’re working on it? Pretty please? :)

InnoDB with reduced page sizes wastes up to 6% of disk space

In InnoDB bugs found during research on InnoDB data storage I mentioned MySQL Bug #67963 which was then titled “InnoDB wastes 62 out of every 16384 pages”. I said:

InnoDB needs to occasionally allocate some internal bookkeeping pages; two for every 256 MiB of data. In order to do so, it allocates an extent (64 pages), allocates the two pages it needed, and then adds the remainder of the extent (62 free pages) to a list of extents to be used for single page allocations called FREE_FRAG. Almost nothing allocates pages from that list, so these pages go to waste.

This is fairly subtle, wasting only 0.37% of disk space in any large InnoDB table, but nonetheless interesting and quite fixable.

Wasting 0.37% of disk space was unfortunate, but not a huge problem…

MySQL 5.6 brings adjustable page sizes

Since MySQL 5.6, InnoDB supports adjustable page size through the new configuration parameter innodb_page_size1, allowing you to use 4 KiB or 8 KiB pages instead of the default 16 KiB pages. I won’t go into the reasons why you would want to reduce the page size here. Instead, coming back to MySQL Bug #67963… neither the number 62 nor 16384 are fixed; they are in fact variable.

The number 62 actually comes from the size of the extent, in pages. For 16 KiB pages, with 1 MiB extents, this works out to 1048576 / 16384 = 64 pages per extent. Since two pages are stolen for bookkeeping, that leaves the 62 pages above.

The number 16384 comes from InnoDB’s need to repeat these bookkeeping pages every so often — it uses the page size, in pages, for this frequency2, which means that for 16 KiB pages it repeats the bookkeeping pages every 16,384 pages.

If we use 8 KiB pages instead by setting innodb_page_size=8k in the configuration? The number of pages per extent changes to 1048576 / 8192 = 128 pages per extent. The frequency of the bookkeeping pages changes to every 8192 pages. So we now waste 126 / 8192 = ~1.5% of disk space for this bug.

If we use 4 KiB pages instead by setting innodb_page_size=4k in the configuration? The number of pages per extent changes to 1048576 / 4096 = 256 pages per extent. The frequency of the bookkeeping pages changes to every 4096 pages. So we now waste 254 / 4096 = ~6.2% of disk space for this bug.

An aside: When is an extent not an extent?

An interesting aside to all of this is that although the manual claims it is so, in InnoDB an extent is actually not always 1 MiB. It is actually (1048576 / innodb_page_size) * table_page_size. As far as I can tell this was more or less a mistake in the InnoDB compression code; it should have used the table’s actual page size (which comes from KEY_BLOCK_SIZE aka zip_size for compressed tables) rather than the system default page size (UNIV_PAGE_SIZE) which was at the time fixed at compile-time.

So, for a system with innodb_page_size=16k (the default), and a table created with ROW_FORMAT=COMPRESSED KEY_BLOCK_SIZE=8, the “extent” is actually only 512 KiB.

The bug gets even worse if you mix InnoDB compression in…

If you mix the new configurable page size feature with InnoDB compression, due to the above weirdness with how extent size really works, you can get some pretty interesting results.

For a system with innodb_page_size=4k and a table created with ROW_FORMAT=COMPRESSED KEY_BLOCK_SIZE=1, the system actually wastes 254 / 1024 = ~24.8% (!!!) of the disk space to this bug (in other words, every 4th extent will be an unusable fragment extent).

A new title for Bug #67963, and a conclusion

I updated Bug #67963 to add the above and changed the title to “InnoDB wastes almost one extent out of every innodb_page_size pages” to be slightly more accurate with the reality.

If you were thinking about using 4k pages in your systems, you may want to subscribe to the bug, and maybe hold off, unless you can afford to waste more than 6% of your disk space (in addition to all other waste).

1 And prior to MySQL 5.6, you could always have changed it by changing UNIV_PAGE_SIZE in the source code and recompiling.

2 As the page size is reduced, there is less disk space available to store the bitmaps that need to be stored in the XDES page, and reducing the amount of pages represented by each page proportionally with the page size is a good enough way to do it.

A little fun with InnoDB multi-versioning

Consider the following commands, executed in the MySQL CLI on a new connection with no special preparation (and pay special attention to the execution time):

mysql> show create table t \G
*************************** 1. row ***************************
       Table: t
Create Table: CREATE TABLE `t` (
  `a` int(10) unsigned NOT NULL,
  `b` int(10) unsigned NOT NULL,
  PRIMARY KEY (`a`)
) ENGINE=InnoDB DEFAULT CHARSET=latin1
1 row in set (0.00 sec)

mysql> select * from t;
Empty set (5.20 sec)

mysql> select count(*) from t;
+----------+
| count(*) |
+----------+
|        0 |
+----------+
1 row in set (5.22 sec)

mysql> select * from t where a = 10;
Empty set (0.00 sec)

mysql> select * from t where a < 10;
Empty set (5.35 sec)

mysql> select * from t where a > 10;
Empty set (5.41 sec)

mysql> select * from t where a in (10, 20, 30);
Empty set (0.00 sec)

mysql> select * from t where a > 1000000;
Empty set (0.00 sec)

mysql> select * from t where a > 500000;
Empty set (2.60 sec)

What is happening? Why is it so slow? Why are some things slow and others not?

Looking for the culprit

The SHOW PROCESSLIST doesn’t show anything unusual:

mysql> show processlist;
+----+------+-----------------+------+---------+------+-------+------------------+
| Id | User | Host            | db   | Command | Time | State | Info             |
+----+------+-----------------+------+---------+------+-------+------------------+
|  6 | root | localhost:34840 | test | Query   |    0 | init  | show processlist |
|  8 | root | localhost:34842 | test | Sleep   | 2116 |       | NULL             |
+----+------+-----------------+------+---------+------+-------+------------------+
2 rows in set (0.00 sec)

If we look at the SHOW ENGINE INNODB STATUS there’s a clue: a transaction that’s been busy being evil:

---TRANSACTION 1481, ACTIVE 2183 sec
3487 lock struct(s), heap size 570920, 2001743 row lock(s), undo log entries 11000000
MySQL thread id 8, OS thread handle 0x7fca27ba2700, query id 5000144 localhost 127.0.0.1 root cleaning up  

It also shows up in information_schema.innodb_trx:

mysql> select * from information_schema.innodb_trx \G
*************************** 1. row ***************************
                    trx_id: 1481
                 trx_state: RUNNING
               trx_started: 2014-04-17 01:38:27
     trx_requested_lock_id: NULL
          trx_wait_started: NULL
                trx_weight: 11003487
       trx_mysql_thread_id: 8
                 trx_query: NULL
       trx_operation_state: NULL
         trx_tables_in_use: 0
         trx_tables_locked: 0
          trx_lock_structs: 3487
     trx_lock_memory_bytes: 570920
           trx_rows_locked: 2001743
         trx_rows_modified: 11000000
   trx_concurrency_tickets: 0
       trx_isolation_level: REPEATABLE READ
         trx_unique_checks: 1
    trx_foreign_key_checks: 1
trx_last_foreign_key_error: NULL
 trx_adaptive_hash_latched: 0
 trx_adaptive_hash_timeout: 10000
          trx_is_read_only: 0
trx_autocommit_non_locking: 0
1 row in set (0.01 sec)

How was the transaction evil?

I used the following script to INSERT one million rows, and then UPDATE each row ten times, leaving the transaction open and un-committed:

#!/usr/bin/env ruby

require "mysql"

m = Mysql.new("127.0.0.1", "root", "", "test", 13000)

m.query("DROP TABLE IF EXISTS t")
m.query("CREATE TABLE t (a INT UNSIGNED NOT NULL, b INT UNSIGNED NOT NULL, PRIMARY KEY (a)) ENGINE=InnoDB")

m.query("START TRANSACTION")

(1..1000000).each do |i|
  m.query("INSERT INTO t (a, b) VALUES (#{i}, 0)")
  puts "Inserted #{i} rows..." if i % 10000 == 0
end

(1..10).each do |i|
  m.query("UPDATE t SET b=#{i}")
  puts "Updated #{i} times..."
end

sleep 1000000

As described in The basics of the InnoDB undo logging and history system, these modifications are made to the database, and there is a single index structure used by both the uncommitted write transaction and my read transaction. Although my read transaction is not able to see any of the rows inserted and subsequently modified by the writing transaction, in order to figure that out, it needs to apply all the undo records to each row encountered (10 each). This, of course, takes time.

Leaky visibility

You can see some of the hidden visibility of the in-flight data “leaking” in the amount of time different operations take. For instance, scanning all rows takes more than 5 seconds, but using the condition a > 1000000 can be immediately evaluated. Suspiciously the condition a > 500000 takes approximately half as much time as scanning all rows (because it has half as much work to do). Of course, all of these queries return an empty set.

Applicability to the real world

While almost no one would intentionally do what my script does, I have actually seen the end result in production systems before: a very large transaction updated a row many times resulting in many slow queries trying to access the table. Some queries would be fast, some slow.

Serious implications for system administrators and DBAs

There are no limits to how much space a user can consume in the form of undo history. I have filed MySQL Bug #72362: “Users may use an unlimited amount of undo space” suggesting that configuration options be added to limit the amount of undo space which a user could cause to be consumed. I wrote the following:

As InnoDB is currently implemented, it is possible for users to use an unlimited amount of space for undo history by either:

  1. Creating a single or many large transactions writing to as few as one row many times, directly accumulating undo history.
  2. Leaving open a transaction (while minimally keeping it alive) with a read view, indirectly accumulating undo history by preventing purge.

(Additionally, the user could combine both of these approaches, leaving open a transaction with a read view while simultaneously generating a large number of small transactions which individually have a small amount of undo history. This may better prevent detection of the culprit.)

Both of these situations allow a regular user, without special privileges, to consume large amounts of disk space in the system tablespace, potentially causing the system tablespace to be expanded to consume all filesystem space and without an easy recourse from the system administrator.

And I’ve suggested that new configuration options be added for the following:

  • Limit the undo space consumed by a single transaction.
  • Limit the aggregate undo space consumed by a given user.
  • Limit the age of the transaction read view for a given user.